Whats’ new¶
Changes, newest first :
- V1.2.6:
- a versatile datafiles exploration method is associated to datasets: see explore()
- V1.2.2:
- Introduce doc for project CMIP6 : cmip6 and example data_cmip6drs.py
- V1.2:
- New operators:
- ensemble_ts_plot (ensemble_ts_plot : plot time series), with python-user-friendly shortcut ts_plot ( ts_plot() ): an alternative to curves (curves : plot multiple profiles (along p, lat, lon, time, ...)) for time series, with more possibilities for customization
- cLinearRegression (cLinearRegression : performs a linear regression between X and Y): computes linear regressions between two lon/lat/time datasets (same size) or between a time series and a lon/lat/time
- curl_tau_atm (curl_tau_atm : computes wind stress curl on regular grid (usually atmosphere)):to compute the wind stress curl on regular grids (typically atmospheric grids)
- lonlatvert_interpolation (lonlatvert_interpolation()) replaces lonlatpres_interpolation to make it more generic and suitable for CliMAF
- Added crealms() to have a mechanism of alias on the realms names (as for the frequencies)
- when creating a portable atlas (directory containing the html index with the figures, using the ‘dirname’ option of cell()), we now have an index file in the directory listing all the figures of the atlas with their CRS. This allows any tool to parse this index and filter the figures with keywords (in the CRS).
- Added cscalar() : this function returns a float in python when applied on a CliMAF object that is supposed to have one single value. It uses cMA to import a masked array and returns only the float.
- Allow to choose log directory (for files climaf.log and last.out), using environment variable CLIMAF_LOG_DIR
- Bug fix on ds() for the access to daily datasets with the CMIP5 project
- New operators:
======= end
2017/05/02:
- Change ncl default for operator curves (see curves : plot multiple profiles (along p, lat, lon, time, ...)): plot axis range is now between minimum and maximum of all fields (instead of first member of ensemble)
2017/04/18:
- Transparent ftp access to remote data is now possible. See toward the end of entry dataloc to know how to describe a project for remote data. A local directory holds a copy of remote data. This directory is set using environment variable ‘CLIMAF_REMOTE_CACHE’ (defaults to $CLIMAF_CACHE/remote_data), see Installing (or using an installed version, at CNRM or IPSL)
2017/02/21:
- Fixes a bug about a rarely used case (operator secondary outputs)
2017/01/25:
- New arguments for standard operator plot (see plot : map, cross-section and profile plot of one or two fields, and vectors plot over a map) : xpolyline, ypolyline and polyline_options for adding a polyline to the plot
- The scripts output files, which have temporary unique names until they are fully tagged with their CRS and moved to the cache, are now located in cache (instead of /tmp)
2016/12/14:
- Update paths for CNRM (due to restructuring Lustre file system)
- Significant improvement of cache performance (70 times faster for a cache containing more than 8000 objects). You must reset your cache for getting the improvement. You may use ‘rm -fR $CLIMAF_CACHE’ or function craz()
- Fix issue occurring in parallel runs (especially for PDF outputs):
- the scripts output files now have temporary unique names until they are fully tagged with their CRS and moved to the cache
- a new shell script is available to clean corrupted PDF files in cache - i.e. without CRS (see clean_pdf.sh)
- New standard operator ccdfmean_profile_box to compute the vertical profile of horizontal means for 3D fields on a given geographical domain (see ccdfmean_profile_box : computes the vertical profile of horizontal means for 3D fields on a given geographical domain)
- New method of cdataset class: check() checks time consistency of first variable of a dataset or ensemble members
- Bug fixes for operator curves (see curves : plot multiple profiles (along p, lat, lon, time, ...)) when time data conversion is necessary
- New standard operator hovm for plotting Hovmöller diagrams (time/lat or lon, or time/level) for any SST/climate boxes and provides many customization parameters; see hovm : plot Hovmöller diagrams on a given or global domain (SST/climate boxes, ... )
- Function hovm_params() provides domain for some SST/climate boxes
- Changes for default argument title: if no title value is provided when invoking graphic operators, no title will be displayed (formerly, the CRS expression for an object was provided as a default value for title)
- Bug fixes in test install
- Bug fixes for plot (see plot : map, cross-section and profile plot of one or two fields, and vectors plot over a map) when using argument ‘proj’ with an empty string
2016/06/30:
- Input for function fixed_fields(), which allows to provide fixed fields to operators: path of fixed fields may depend now also on grid of operator’s first operand
- automatic fix of Aladin outputs attribute ‘coordinates’ issues, provided you set environment variable CLIMAF_FIX_ALADIN_COORD to anything but ‘no’. This adresses the wrong variable attribute ‘coordinates’ with ‘lat lon’ instead of ‘latitude longitude’ (../scripts/mcdo.sh, see function aladin_coordfix())
- exiv2 (Image metadata manipulation tool) is embarked in CliMAF distribution: <your_climaf_installation_dir>/bin/exiv2
2016/05/24:
- Change default for arguments scale_aux and offset_aux for standard operators plot (see plot : map, cross-section and profile plot of one or two fields, and vectors plot over a map) and curves (see curves : plot multiple profiles (along p, lat, lon, time, ...)): no scaling instead of main field scaling
- Changes for standard operator plot (see plot : map, cross-section and profile plot of one or two fields, and vectors plot over a map) :
- add argument date for selecting date in the format ‘YYYY’, ‘YYYYMM’, ‘YYYYMMDD’ or ‘YYYYMMDDHH’
- time, date and level extractions apply on all fields now from 2D to 4D, instead of only 3D and 4D
- log messages, when a time or level extraction is made, are also performed
- Bug fixes when using mpCenterLonF argument
2016/05/04 - Version 1.0.1 :
- html package :
- Change interface for function line() : now use a list of pairs (label,figure_filename) as first arg
- add function link_on_its_own_line()
- html package :
2016/04/22 - Version 1.0 :
Ensembles are now handled as dictionnaries. This breaks upward compatibility. This allows to add and pop members easily. The members can be ordered. See cens()
Function plot_params() provides plot parameters (colormap, values range, ...) for a number of known geophysical variables, and allows its customization. The expectation is that everybody will contribute values that can be shared, for improving easy common intepretation of evaluation plots
New standard operators:
ml2pl to interpolate a 3D variable on a model levels to pressure levels; works only if binary ml2pl is in your PATH
ccdo2 and ccdo_ens coming in addition to the very useful ccdo swiss knife; ccdo2 takes two datasets as input, and ccdo_ens takes an ensemble of CliMAF datasets (built with eds or cens). Warning : ccdo_ens is not yet optimized for large datasets which data for a single member are spread over numerous files
regridll for regridding to a lat-lon box (see regridll : regrid an object to a lat-lon box of a CDO regular grid)
A whole new set of functions, that are mainly ‘science oriented’ shortcuts for specific use of CliMAF operators:
fadd, fsub, fmul and fdiv (now providing the 4 arithmetic operations). Work between two CliMAF objects of same size, or between a CliMAF object and a constant (provided as string, float or integer)
apply_scale_offset to apply a scale and offset to a CliMAF object
diff_regrid and diff_regridn -> returns the difference between two CliMAF datasets after regridding
clim_average provides a simple way to compute climatological averages (annual mean, seasonal averages, one-month climatology...)
annual_cycle returns the 12-month climatological annual cycle of a CliMAF object
zonmean, diff_zonmean and zonmean_interpolation to work on zonal mean fields
- zonmean()
- diff_zonmean()
- zonmean_interpolation(),
Two functions to display a plot in an IPython Notebook: iplot and implot
Functions for an interactive use of ds() and projects:
- summary lists the files linked with a ds() request, and the pairs facet/values actually used by ds()
- projects returns the listing of the available projects
with the associated facets (fancy version of cprojects)
- projects()
New Drakkar CDFTools operators interfaced (see example cdftools.py):
Modification for example atlasoce.py because CDFTools were modified
New function cerr() displays file ‘last.out’ (stdout and stderr of script call)
New arguments for standard operators plot (see plot : map, cross-section and profile plot of one or two fields, and vectors plot over a map) and curves (see curves : plot multiple profiles (along p, lat, lon, time, ...)) : scale_aux and offset_aux to scale the input auxiliary field for plot and to scale of the second to the nth input auxiliary field for curves.
Changes for standard operator plot (see plot : map, cross-section and profile plot of one or two fields, and vectors plot over a map) :
- Tick marks are smartly adapted to the time period duration for (t,z) profiles
- new arg fmt to change time axis labels format
- new arg color to define your own color map using named colors
- you can now use argument invXY for cross-section
- Add possibility to turn OFF the data re-projection when model is already on a known native grid (currently Lambert only) (see relevant § of the doc)
- Bug fixes :
- for argument reverse
- when reading latitude and longitude in file ‘coordinates.nc’ for curvilinear grid;
- for y axis style when invXY is used for (t,z) profiles
Change for standard operator slice : extract a slice on specified dimension now at a given range instead of a given value before (see slice : extract a slice at a given dimension’s range)
Technical :
- it is possible to discard stamping of files in cache (see cache.stamping)
- disambiguating filenames in cache relies only on their length (60)
- scripts execution duration is now only logged, at level ‘info’
- critical errors now exit
- fix in mcdo.sh:nemo_timefix
- project ‘em’ is based on generic organization
- re-design code of gplot.ncl
2016/03/25 :
- Changes for standard operator plot (see plot : map, cross-section and profile plot of one or two fields, and vectors plot over a map) :
- new argument reverse to reverse colormap;
- a change breaking backward compatibility : optional argument linp was renamed y and its default was modified (now default is a vertical axis with data-linear spacing, so you have to specify y=”log” to obtain the same plot make without argument linp before);
- min and max was extended to define the range of main field axis for profiles;
- this operator can now plot (t,z) profiles;
- bug fixes if data file only contains latitude or longitude;
- bug fixes to custom color of auxiliary field for profiles via argument aux_options
- Changes for standard operator curves (see curves : plot multiple profiles (along p, lat, lon, time, ...)) :
- new arguments :
- aux_options for setting NCL graphic resources directly for auxiliary field (it is recommended to use this argument only if you plot exactly two fields);
- min and max to define min and max values for main field axis
- a change breaking backward compatibility : optional argument linp was renamed y, a new axis style is proposed (data-linear spacing) and its default was modified (now default is a vertical axis with data-linear spacing, so you have to specify y=”log” to obtain the same plot make without argument linp before);
- add field unit after ‘long_name’ attribute of field in title of field axis
- new arguments :
- New standard operators slice, mask and ncpdq : see slice : extract a slice at a given dimension’s range, mask : set a given value as missing value and ncpdq: netCDF Permute Dimensions Quickly
- Changes for standard operator plot (see plot : map, cross-section and profile plot of one or two fields, and vectors plot over a map) :
- A new example in the distribution : see atlasoce.py
- File ‘angle_EM.nc’ in ‘tools’ directory was renamed angle_data_CNRM.nc to be compatible with the new project ‘data_CNRM’
- Adapt to Ciclad new location for CMIP5 data, and improve install doc for Ciclad
- 2016/02/25 :
- Changes for standard operator plot (see plot : map, cross-section and profile plot of one or two fields, and vectors plot over a map) :
- new arguments :
- shade_below and shade_above to shade contour regions for auxiliary field;
- options, aux_options and shading_options for setting NCL graphic resources directly
- color filling is smoothed to contours
- Standard operator ‘curves’ now handle multiple profile cases : time series, profile along lat or lon, and profile in pressure/z_index. It also allows to set NCL graphic ressources directly : see curves : plot multiple profiles (along p, lat, lon, time, ...).
- Standard operators ‘lines’ and ‘timeplot’ were removed, and replaced by ‘curves’: see curves : plot multiple profiles (along p, lat, lon, time, ...)
- New function cpage_pdf() allows to create a PDF page of figures array using ‘pdfjam’. See example figarray.
- A new output format allowed for graphic operators : eps; see cscript(). This needs an install of ‘exiv2’ - see Requirements and ackowledgements
- A new standard operator, to crop eps figures to their minimal size : cepscrop; see cepscrop : crop eps figures to their minimal size
- Changes for several functions of package climaf.html (which easily creates an html index which includes tables of links -or thumbnails- to image files). See link(), cell(), line(), fline(), flines():
- new arguments:
- dirname to create a directory wich contains hard links to the figure files; allows to create an autonomous, portable atlas
- hover for displaying a larger image when you mouse over the thumbnail image
- change for thumbnail argument: it can also provide the geometry of thumbnails as ‘witdh*height’
- Technical changes:
- For function cpage_pdf() (which creates a PDF page of figures array using ‘pdfjam’): you can set or not a backslash before optional argument ‘pt’ (for title font size) as LaTeX commands. See example figarray.
- Data access was modified for several examples:
- For cdftools, cdftools_multivar and cdftransport: a new project ‘data_CNRM’ was declared instead of ‘NEMO’ old project; this new project uses data available at CNRM in a dedicated directory “/cnrm/est/COMMON/climaf/test_data”, which contains both Nemo raw outputs, monitoring outputs (with VT-files) and fixed fields.
- Example gplot: now works with project ‘example’ (instead of ‘EM’ project) and also with the new project ‘data_CNRM’ at CNRM for rotating vectors from model grid on geographic grid.
- Two examples gplot and cdftools_multivar were added to the script which tests all examples test_examples
- cpdfcrop, which is used by operators ‘cpdfcrop’ and ‘cepscrop’ tools, is embarked in CliMAF distribution: <your_climaf_installation_dir>/bin/pdfcrop
- Python 2.7 is required and tested in test_install
- Bug fixes in anynetcdf to import a module from ‘scipy.io.netcdf’ library (for reading and writing NetCDF files).
- Change format for log messages. For restoring former, verbose format see Experts’ corner.
- cshow(), when it displays pdf or eps figures, does use a multi-page capable viewer (xdg-open) if it is available. Otherwise, it uses ‘display’
2015/12/08 :
- Allow operator plot to use a local coordinates file, for dealing with Nemo data files having un-complete ‘nav_lat’ and ‘nav_lon’. See navlat issues with plot. Such files are available e.g. at CNRM in /cnrm/ioga/Users/chevallier/chevalli/Partage/NEMO/
- Change for cpage() :
- argument orientation is now deprecated and preferably replaced by new arguments page_width and page_height for better control on image resolution
- better adjustment of figures in height (if fig_trim is True).
- Fix function cfile() for case hard=True
- 2015/11/27 - Version 0.12 :
Changes for standard operator plot (see plot : map, cross-section and profile plot of one or two fields, and vectors plot over a map) :
- new arguments :
- level and time for selecting time or level;
- resolution for controling image resolution
- format : graphical format : either png (default) or pdf
- 17 new optional arguments to adjust title, sub-title, color bar, label font, label font height , ... (see More plot optional arguments )
- trim to turn on triming for PNG figures
- optional argument levels was renamed colors
- code re-design
- if running on Ciclad, you must load NCL Version 6.3.0; see Configuring CliMAF
New arguments for cpage() :
- title. See example figarray
- format : graphical output format : either png (default) or pdf
Two new output formats allowed for operators : ‘graph’ and ‘text’; see cscript()
- ‘graph’ allows the user to choose between two graphic output formats: ‘png’ and ‘pdf’ (new graphic ouput format), if the corresponding operator supports it (this is the case for plot());
- ‘txt’ allows to use any operator that just ouputs text (e.g. ‘ncdump -h’). The text output is not managed by CliMAF (but only displayed).
Two new standard operators :
- ncdump : show only the header information of a netCDF file; see ncdump : show only the header information of a netCDF file
- cpdfcrop : crop pdf figures to their minimal size, preserving metadata; see cpdfcrop : crop pdf figures to their minimal size
An operator for temporary use : curves (see curves : plot multiple profiles (along p, lat, lon, time, ...)) :
- 2015/10/19 - Version 0.11 :
- For cpage() (which creates an array of figures), default keywords changed : fig_trim=False -> fig_trim=True, page_trim=False -> page_trim=True. See example figarray.
- New function efile() allows to apply cfile() to an ensemble object. It writes a single file with variable names suffixed by member label.
- The general purpose plot operator (for plotting 1D and 2D datasets: maps, cross-sections and profiles), named plot, was significantly enriched. It now allows for plotting an additional scalar field displayed as contours and for plotting an optional vector field, for setting the reference longitude, the contours levels for main or auxiliary field, the reference length used for the vector field plot, the rotation of vectors from model grid to geographic grid, ... See plot : map, cross-section and profile plot of one or two fields, and vectors plot over a map
- 2015/09/23 - Version 0.10 :
- Interface to Drakkar CDFTools: a number of operators now come in two versions : one accepting multi-variable inputs, and one accepting only mono-variable inputs (with an ‘m’ suffix)
- Multi-variable datasets are managed. This is handy for cases where variables are grouped in a file. See an example in : cdftransport.py , where variable ‘products’ is assigned
- Package climaf.html has been re-designed : simpler function names (fline(), flines(), addition of basic function line() for creating a simple links line ; improve doc
- New function fds() allows to define simply a dataset from a single data file. See example in data_file.py
- 2015/09/08 - Version 0.9 :
- Operator ‘lines’ is smarter re.time axis: (see curves : plot multiple profiles (along p, lat, lon, time, ...)):
- Tick marks are smartly adapted to the time period duration.
- When datasets does not cover the same time period, the user can choose wether time axis will be aligned to the same origin or just be the union of all time periods
- Interface to Drakkar CDFTools: cdfmean, cdftransport, cdfheatc, cdfmxlheatc, cdfsections, cdfstd, cdfvT; you need to have a patched version of Cdftools3.0; see CDFTools operators and examples : cdftransport.py and cdftools.py
- CliMAF can provide fixed fields to operators, which path may depend on project and simulation of operator’s first operand (see fixed_fields())
- Fixes :
- datasets of type ‘short’ are correctly read
- operator’s secondary output variables are duly renamed, according to the name given to operator’s the secondary output when declaring it using script()
- 2015/08/27 - Version 0.8 :
- Basics
- A CHANGE BREAKING BACKWARD COMPATIBILITY : default facet/attribute ‘experiment’ was renamed ‘simulation’. It is used for hosting either CMIP5’s facet/attribute ‘rip’, or for ‘EXPID’ at CNRM, or for JobName at IPSL. All ‘projects’ and examples, and this documentation too, have been changed accordingly. Please upgrade to this version if you want a consistent documentation. A facet named ‘experiment’ was added to project CMIP5 (for hosting the ‘CMIP5-controlled-vocabulary’ experiment name, as e.g. ‘historical’).
- default values for facets are now handled on a per-project basis. See cdef() and cdataset().
- Binary climaf can be used as a back end in your scripts, feeding it with a string argument. See Using CliMAF as a back end in your scripts
- Outputs and rendering
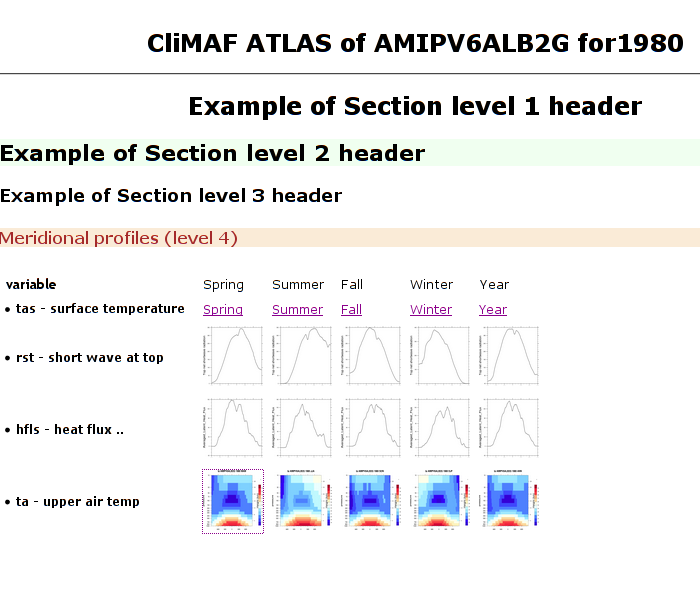
- Package climaf.html allows to easily create an html index, which includes tables of links (or thumbnails) to image files; iterating on e.g. seasons and variables is handled by CliMAF. See :
- a screen dump for such an index :
- the corresponding rendering code in index_html.py
- the package documentation : climaf.html
- Function cfile() can create hard links : the same datafile (actually : the samer inode) will exists with two filenames (one in CliMAF cache, one which is yours), while disk usage is counted only for one datafile; you may remove any of the two file(name)s as you want, without disturbing accessing the data with the other filename.
- When creating a symlink between a CliMAF cache file and another filename with function cfile() : the symlink source file is now ‘your’ filename; hence, no risk that some CliMAF command does erase it ‘in your back’; and CliMAf will nicely handle broken symlinks, when you erase ‘your’ files
- Inputs
- climatology files, which have a somewhat intricated time axis (e.g. monthly averages over a 10 year period) can now be handled with CliMAF regular time axis management, on the fly, by modifying the basic data selection script: it can enforce a reference time axis by intepreting the data filename. This works e.g. for IPSL’s averaged annual-cycle datafiles. If needed, you may change function timefix() near line 30 in mcdo.sh
- automatic fix of CNRM’s Nemo old data time_axis issues, provided you set environment variable CLIMAF_FIX_NEMO_TIME to anything but ‘no’. This will add processing cost. This adresses the wrong time coordinate variable t_ave_01month and t_ave_00086400
- speed-up datafiles scanning, incl. for transitory data organization during simulation run with libIGCM
- fixes and minor changes:
- check that no dataset attribute include the separator defined for corresponding project
- fix issues at startup when reading cache index
- rename an argument for operator ‘plot’ : domain -> focus
- scripts argument ‘labels’ now uses ‘$’ as a separator
- 2015/05/20 - Version 0.7 :
- Handle explicitly defined objects ensembles (see cens) and explicit dataset ensembles (see eds(). Operators which are not ensemble-capable will be automagically looped over members. See examples in ensemble.py.
- New standard operator lines for plotting profiles or other xy curves for ensembles; see curves : plot multiple profiles (along p, lat, lon, time, ...)
- Standard operator plot has new arguments : contours for adding contour lines, domain for greying out land or ocean; see plot : map, cross-section and profile plot of one or two fields, and vectors plot over a map
- Extended access to observation data as managed by VDR at CNRM : GPCC, GPCP, ERAI, ERAI-LAND, CRUTS3, CERES (in addition to OBS4MIPS, and CAMI); see Pre-defined projects and datasets and examples in data_obs.py.
- Special keyword crs is replaced by keyword title : the value of CRS expression for an object is provided to script-based operators under keyword title, if no title value is provided when invoking the operator. Scripts can also independanlty use keyword crs for getting the CRS value
- cpage keywords changed : widths_list -> widths, heights_list -> heights
- 2015/05/11 - Version 0.6.1 :
- Add a macro feature : easy definition of a macro from a compound object; you can save, edit, load... and macros are used for interpreting cache content. See cmacro() and an example in macro.
- A general purpose plot operator, named plot, is fine for plotting 1D and 2D datasets (maps, cross-sections, profiles, but not Hoevmoeller...) and replaces plotxesc and plotmap. It allows for setting explicit levels in palette, stereopolar projection, vertical coordinate ... See plot : map, cross-section and profile plot of one or two fields, and vectors plot over a map
- Can list or erase cache content using various filters (on age, size, modif date ...); disk usage can be displayed. See clist(), cls(), crm(), cdu(), cwc()
- Can create an array of figures using cpage(). See example figarray.
- Can cope with un-declared missing values in data files, as e.g. Gelato outputs with value=1.e+20 over land, which is not the declared missing value ; See calias() and em
- When declaring data re-scaling, can declare units of the result (see calias())
- Can declare correspondance between project-specific frequency names and normalized names (see cfreqs()).
- Add : howto ..record a CliMAF session
- Cache content index is saved on exit
- Add an example of seaice data handling and plotting. See seaice.py
- 2015/04/22 - Version 0.6.0 :
- Add operator plotxsec (removed in 0.6.1, see replacement at plot : map, cross-section and profile plot of one or two fields, and vectors plot over a map )
- A number of ‘projects’ are built-in, which describe data organization and data location for a number of analyses and simulations datasets available at one of our data centers, as e.g. CMIP5, OBS4MIPS, OCMPI5, EM, ...) ; see Pre-defined projects and datasets
- Variable alias and variable scaling are now managed, on a per-project basis. See function calias()
- Derived variables can now be defined on a per-project basis. See function derive()
- CliMAF was proved to work under a CDAT install which uses Python 2.6
- Better explain how to install CliMAf (or not), to run it or to use it as a library; see Installing (or using an installed version, at CNRM or IPSL) and Using CliMAF as a library
- 2015/04/14 - Version 0.5.0 :
- A versionning scheme is now used, which is based on recommendations found at http://semver.org.
- Starting CliMAF :
- Binary climaf allows to launch Python and import Climaf at once. See Running CliMAF interactively
- File ~/.climaf is read as configuration file , at the end of climaf.api import
- Input data :
- New projects can be defined, with project-specific facets/attributes. See cproject
- A number of projects are ‘standard’ : CMIP5, OCMPIP5, OBS4MIPS, EM, CAMIOBS, and example
- Data location is automatically declared for CMIP5 data at CNRM and on Ciclad (in module site_settings)
- Discard pre-defined organizations ‘OCMPI5_Ciclad’, ‘example’, etc, and replace it by smart use of organization ‘generic’. Note : this leads to some upward incompatibility regarding how data locations are declared for these datasets; please refer to the examples in data_generic.py).
- Access to fixed fields is now possible, and fixed fields may be specific to a given simulation. . See examples in data_generic.py and data_cmip5drs.py
- Operators :
- Explanation is available on how to know how a given operator is declared to CliMAF, i.e. what is the calling sequence for the external script or binary; see ..know which CliMAF operators are available and what they do
- Simplify declaration of scripts with no output (just omit ${out})
- plotmap : this operator now zoom on the data domain, and plot data across Greenwich meridian correctly
- Running CliMAF - messages, cache, errors :
- Verbosity, and cache directory, can be set using environment variables. See Configuring CliMAF
- Simplify use of function clog()
- Log messages are indented to show recursive calls of ceval()
- Quite extended use of Python exceptions for error handling
- 2015/04/06 :
- time period in CRS and as an argument to ‘ds’ is shortened unambiguously and may show only one date
- function cfile has new arguments : target and link
- CMIP5 facets ‘realm’ and ‘table’ are handled by ‘ds’, ‘dataloc’ and ‘cdef’
- organization called ‘generic’ allow to describe any data file hierarchy and naming
- organization called ‘EM’ introduced, and allows to handle CNRM-CM outputs as managed by EM
- default option for operator regrid is now ‘remapbil’ rather than ‘remapcon2’
- log messages are tabulated
- a log file is added, with own severity level, set by clog_file
- operators with format=None are also evaluated as soon as applied - i.e. cshow no more needednon ncview(...)
Note : Issues with CliMAF and future work are documented at https://github.com/senesis/climaf/issues